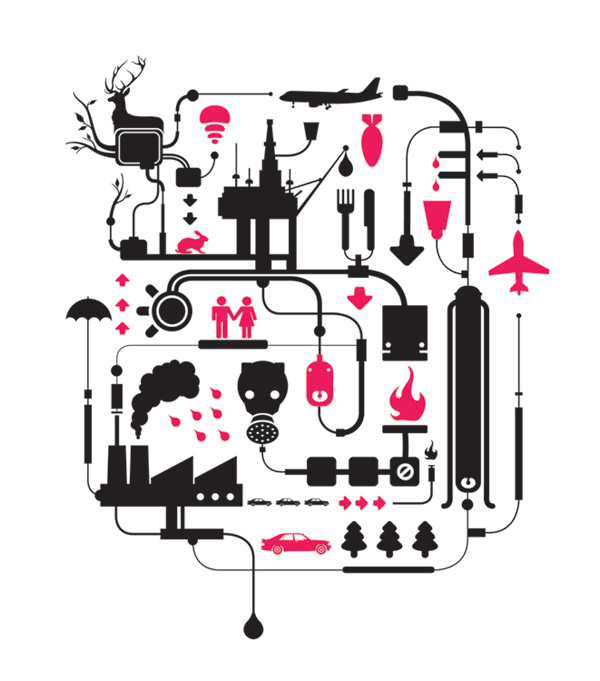
While struggling to illustrate complex environmental phenomena this weekend I stumbled upon this great life-cycle diagram by Mats Ottdal – a cover graphic for a Vector Pollution Library (something I would love to buy).

While struggling to illustrate complex environmental phenomena this weekend I stumbled upon this great life-cycle diagram by Mats Ottdal – a cover graphic for a Vector Pollution Library (something I would love to buy).