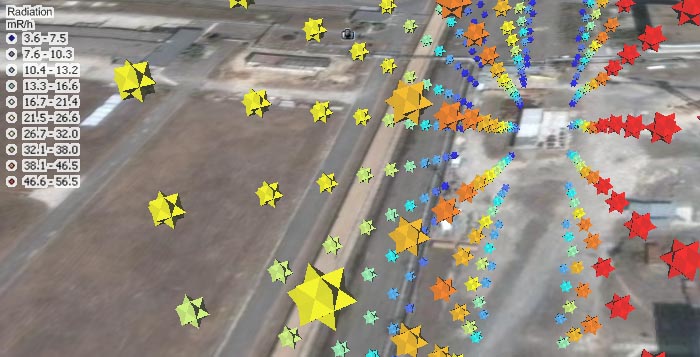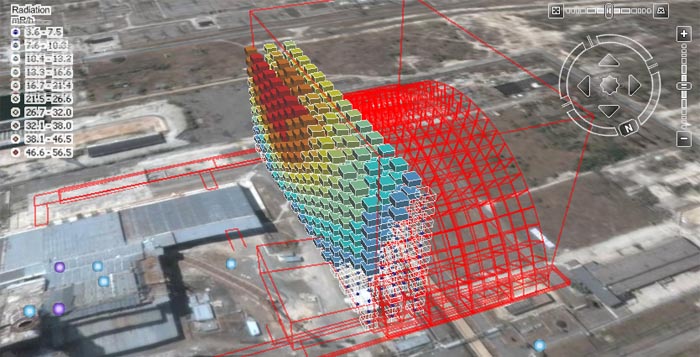
there are a lot of things we can’t see, and many of them we wouldn’t be able to understand even if we could ‘see’ them – especially when you need to see through something to understand densities, temperatures, radiation,or anything that varies along three (or more) dimensions. valery hronusov posted a series of add-ons to google earth that depict the radiation levels around the chernobyl nuclear power plant. notice how in the visualization above, you get a clear idea of hot and cold spots, whereas the visualization technique below (from a different angle) allows you get to see ‘through’ the radiation.